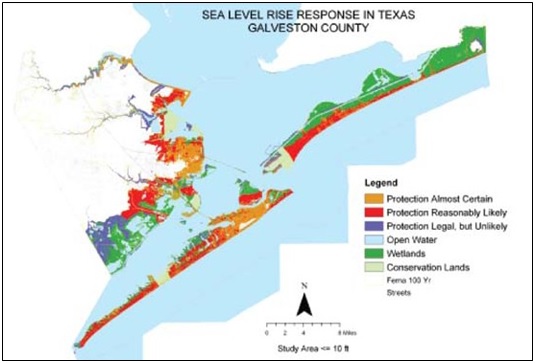
Figure 11. Sea level rise response map constructed for the EPA. Brown indicates developed
areas. Red areas are potentially inundatable lands, under 10ft amsl, that are reasonably likely to be developed in the next 50 years or so.

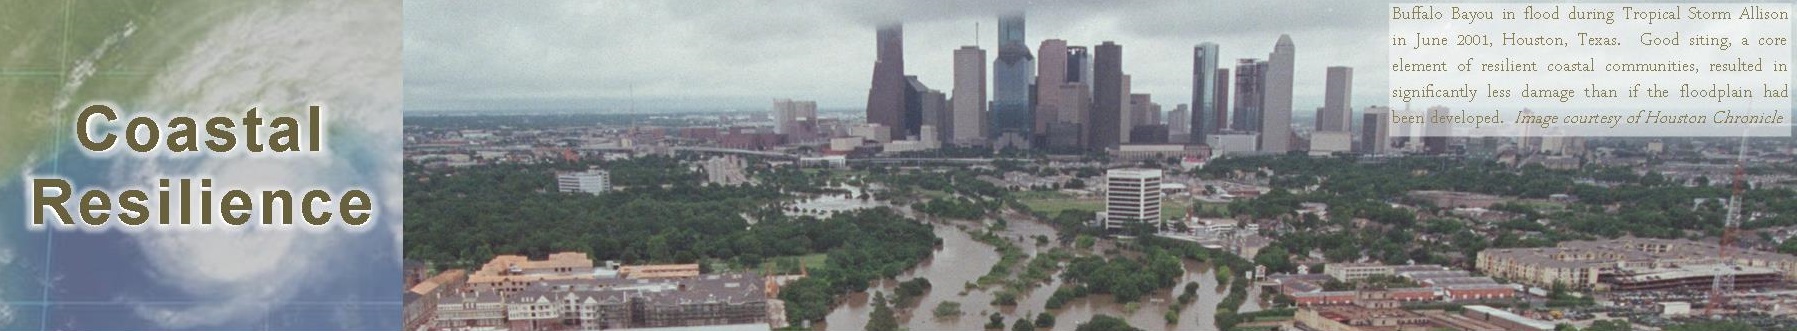 Coastal Resilience
What Policy Makers Need to Know
Figure 11. Sea level rise response map constructed for the EPA. Brown indicates developed
areas. Red areas are potentially inundatable lands, under 10ft amsl, that are reasonably likely to be developed in the next 50 years or so.