The preeminent technical question is how to identify which lands could be inundated under a variety of sea level rise scenarios. Depending on the sea level rise scenario chosen (i.e, the number of feet predicted to rise), there may or may not be sufficiently detailed topographic maps available to make these determinations. Most topographic maps along the Gulf Coast have a contour interval of 5 feet. A 5 -10 foot level of precision might be sufficient if wide-enough buffers were established for limiting development. More than likely, however, most local and state governments willing to engage in establishment of buffers would prefer a more precise delineation so as to minimize the amount of land tied up in buffers and/or easements.
A new tool for more precise mapping of low-lying coastal environments, LIDAR (Laser Imaging Detection and Ranging), is now available and has already been used to one degree or another in most of the Gulf Coast states, mainly for floodplain characterization and mapping. LIDAR technology enables the construction of digital elevation models with a one-foot or less resolution, making it reasonably easy to construct fairly precise models of coastal inundation under any number of sea level rise scenarios (Gibeaut 2006), and to determine with some level of precision the loss and gain of specific kinds of wetlands. This kind of information could be invaluable for determining where hotspots of loss might occur.
The other piece of information critical to protecting inundatable lands would be to have a good projection of where development is going to occur along the coast, particularly in areas subject to losing critical amounts of essential coastal wetlands. This kind of information could help limit areas where rolling easements might be needed or identify where they might be most effective. Jim Titus of the EPA has been constructing maps along the US coast showing where shoreline protection is likely to occur under conditions of SLR in the future, based on current and future development (Fig. 11). Combining development maps with the kinds of maps constructed by Gibeaut (Fig. 10) could help decision makers determine whether sufficient inundatable lands would be available in the future, and perhaps whether or not rolling easements would even be needed.
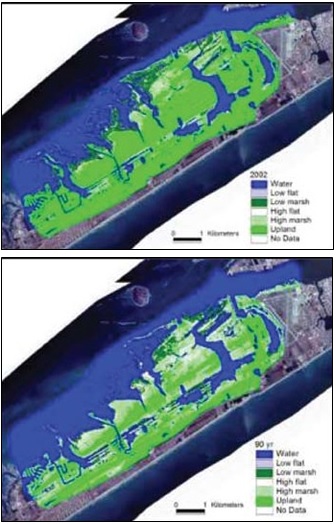
Figure 10. Galveston Island
wetland complex in 2002 (above) and 90 years into the future (below) based on
sea level rise and subsidence over past 100 years (from Gibeaut, 2006). Note large increase in water area and
loss of low marsh and increase in high marsh. This model did not account for possibly accelerating sea level rise
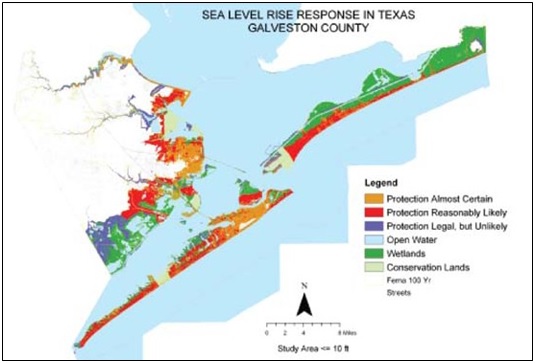
Figure 11. Sea level rise response map constructed for the EPA. Brown indicates developed
areas. Red areas are potentially inundatable lands, under 10ft amsl, that are reasonably likely to be developed in the next 50 years or so.